Monday, August 30, 2010

Aug 30 Market Recap: 1040 again?

After a posting break of sorts.

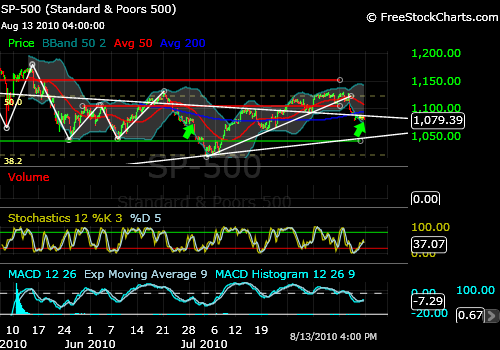
The market staring down the cliff edge once again. After the sharp selloff between 11th and 25th, we almost fell over into calamity territory. Once again the SPX 1040 level was supported, miraculously I'd say, retested and then supported again. Four times in all since we started down the bearish path in April. Once again we are poised to retest, and this time we might fall over. Tomorrow comes home price data, consumer confidence and to top it all FOMC minutes. Doesn't look rosy at all.

I would think the retest is imminent, thanks to how close it is. I do get the sense that the market is still unsure about breaching 1040 or going down to 1010. Although the media noise is definitely touting increased concerns about the economy. We'll see the price action tomorrow to find out how the month of Sept (traditionally a bear month) fares.


Sunday, August 15, 2010

Aug 13 Market Recap - Week look back

Some respite sure, but what to expect going forward. Below is the hourly graph of SPX going back to June. Comparing the June 26 with our current dip there are definite parallels and the market view appears to be of a selloff to touch our green line support. We'll find out.

What is different, first we seem to have some support at SPX 1010, which is the higher low from the bottom 2009. We've stayed above the trendline for over a month and are a bit away from it at the moment (would require another big selloff to change that). Next I think the moving averages SMA 50 and 200 are way different this time around. So what I'd careful of is a bounce higher as the markets participants look for a dip. Something like the July 19 bounce. In case of a dip I'd watch for the trendline support for a reversal.


Friday, August 13, 2010

Aug 12 Market Recap


Not posting much today just a plot of SPX. We may get some respite from the bear action.. but touching lower green support seems likely nearterm

Monday, August 9, 2010

Aug 9 Market Recap - Markets of a thousand cuts

The markets been trading a bit higher lately since almost Aug 1,2010. Was seeing some weakness as short interest increased as we touched the 50% retracement. The thousand or four :) are marked on the chart below. Look at the weakness last week, the support line has held things together so far and we have crossed the 50% line convincingly this time. How much higher, we've talked about it earlier, 1140 remains the high target. As of the moment I'd be looking to short there abouts.

Tuesday, August 3, 2010

Aug 3 Market Recap - S&P's 10 month range


I was looking at my chart (SPX daily) that I've posted many times, and noticed how we've been dissing the bears somewhat and not really rallying. Then I noticed my two lines, the red - resistance and the green - support. I looked at it through 2009 and seems that we could say we've traded in this range since we entered it Sep 2009! That's about 10 months ago!. Anyway so I guess its important and would be interesting to keep an eye on. Breaking above the red then might seem a bit implausible no? Although we've got to go over the 50% line first.


The stochastics were similar right before the flash crash

Monday, August 2, 2010

Aug 2 Market Recap - Breaking all barriers


Sharp rally today continuing the bounce up, SPX closed up at 1125.86. Markets been overlooking a descent amount of negative news later ref, BP, GDP, initial claims, Beige book etc. It could just be a setup before we take a sharp turn down, but the number of barriers that have been broken so far is definite signal of a sharp local trend upwards. Few resistances nearby, most important is the the 61.8% retracement May high to July low at 1140. Watch it as a short opportunity. If this gets taken out then we have good room for moving higher


Some important Fib levels are in order

1) 1,576 high in October 2007 to the 666 low in March 2009

23.6%: 881
38.2%: 1,014
50.0%: 1,121
61.8%: 1,228

2) 666 low in March 2009 to the 1,219 high in April 2010

23.6%: 1,089
38.2%: 1,008
50.0%: 943
61.8%: 878


3) 1,219 high in April 2010 to the 1,010 low in July 2010. This is the near term Fib we are in right now, near term high is 1140

23.6%: 1,060
38.2%: 1,090
50.0%: 1,115
61.8%: 1,140

Wednesday, July 28, 2010

July 28 Market Recap - Stocks take a leg down


The bounce off the 50% retracement theme continued today. We've also bounced off the SPX 1100 level, now support, which is significant as breaking below would be confirmation of the down trend. Below is the 5m chart for SPX. Note that the trading range appears to be 1100 and the 50% fib level of 1120. But near term we've bounced off 1100 with some ammunition left on the stochastics.


We've had some negative news, which could have turned us bearing, beige book, consumer confidence and BP. But on the daily chart it appears that the upward trend is still in place.


Tuesday, July 27, 2010

July 27 Market Recap - SPX bounce of the 50% Fib level

SPX rallied yet another day, bouncing off the 50% Fibonnaci retracement level. Chart below shows the 15min bars. I think there is some loss of steam here. If that leads to a selloff is yet to be seen. Today, the market shrugged BP's huge writeoff and a decline in Consumer confidence. The news might overhang tomorrows trading.

Monday, July 26, 2010

July 26 Market Recap - SPX 50% Fib level in play


We've breached the SPX 1100 and are now resting right on the daily MA(200). At SPX 1120 is the 50% retracement level from the high of 2008 and the lows of 2009. The current levels nearness and the large time-range for the Fib, it seems that we shall definitely rally to it. The big question is whether we shall continue beyond it or sell off from it. The markets have rallied hard the last few days and are overbought, market internals are lagging the current rally. Which hints at better odds of a sell off as we touch SPX 1120.


Wednesday, July 21, 2010

July 20 Market Recap - Strong rally day

Strong rebound today from the lows at open (roughly +250pts). Below is the long range chart of SPX (1hr), see how the resistance has played out in the past (since the April highs) It would be critical for the index to break over this line for any hope of a continuation. Beyond it are the daily MA(50) and 1100 (red line) then the MA(200). But we'll see when we get there, although if we cannot then we're back to looking at the abyss. Watch for the resistance tomorrow, it is too near to not be tested, might be a good shorting opportunity.


Monday, July 19, 2010

July 19 Market recap

The weakness I mentioned in the previous post carried into Friday last week, also options expiration day, with the SPX crashing 3%. Today the markets opened higher, slid into negative territory and made a come back to close in the green for the day. IBM reported earnings after hours and missed consensus, markets have turned negative on the news after hours. On the SPX chart, the reversal from the most prominent resistance level 1100 seems to be gaining momentum and a retest of the recent lows of 1020 seems likely, unless news drives us higher.

Thursday, July 15, 2010

Started to slump but news drives markets higher


Markets got wind from news of BP plugging the leak and GS settling with SEC as it was declining from resistance, only to reverse course and rally to close flat for yet another day. Overhead resistance appears to be a 1090 and intraday weakness continued for a second day with news driving markets higher towards close, see arrows on chart below. A short bias on rallies and caution on news as it comes is warranted.


Tuesday, July 13, 2010

Earnings surprises lead the market higher


The market threw a surprise today leaving many bears stopped out and mad! .. The volume picked up a bit after Alcoa reported results. Tonight Intel reported yet another stellar quarter, best in a decade, which could push us higher over a few resistance. Just what the doctors ordered for the bulls. Notice SPX upward resistance level 1100 is back in play. SMA(50) is where the market is resting at close today. Anything above would officially break the bear market. Be cautious


Monday, July 12, 2010

How much further?


While the last few days we've seen a strong reversal from the calamitous lows below SPX 1040, the rally seems to be losing steam. Trading volume has been quite weak, see chart. While this does not mean a sell off is on the cards, it does imply that the market is looking for a reason for continuation. Earnings releases will provide the fodder (or not) for the market sentiment. Alcoa reported a good quarter today, beating analyst estimates. This is quite interesting as the company is linked to manufacturing and could signal a recovery. We'll look for confirmation in the days to come.


Looking at IWM, the midcap etf, we can see its trading in a channel and the SMA(50, 100) haven't formed the death cross although the pattern is a bearish falling wedge with lower lows and rallies on declining volume. It might send us lower.

Tuesday, July 6, 2010

Unconvincing, but a rally it is.


Stocks rallied earlier on in the day with SPX retesting the all important level of 1040, yielding to the bears towards the close. The bias remains short and we need to rally beyond 1040 to confirm the reversal. There is definitely some support here (see 10min chart below) but we must remain cautious.


Thursday, July 1, 2010

Indications of a reversal?

Interesting times! Hearing a lot of bearish tone (obituary of the stock markets etc., esp from the EWT folks). As I pointed out earlier, SPX level of 1040 is critical and we dipped below it this week. The bulls must hold or push higher or else there is no support all the way down, they did so atleast today. Today we bounced off the lows and formed a bullish wedge pattern on the intraday bars (chart below).


Another interesting theme today was the plunge in gold prices. GLD etf fell $4.65 (chart below) and the 20yr treasury etf dipped lower above the high mark of $100. Seems like a few positives indications, along with the after market S&P futures are pointing higher. But, tomorrow a.m. is employment data and odds are that it would send us south of here.

Tuesday, June 29, 2010

Low's retested after bear setup from Monday


We retested the SPX 1040 support again as the down wave sold off hard today with a -3.10% decline, smashing through the lower channel support.

Monday, June 28, 2010

Market fears another look

The markets stayed put today, so the channel wasn't broken. As we look at what happen next, here is a look at a popular bond ETF, TLT (20yr bond fund). So the theme is that when the Fed reduces rates bond prices rally and stock prices fall, another scenario is when the world is afraid of bad things they run to the safety of the US Treasury (Bond prices rally and stock prices fall). Notice that TLT has rallied to high fear levels of late 2008, and 2009 and is retesting recent times high of 100. This would be something to watch closely. Now, should it fall it would be equally interesting to note if Stock markets still participate in the rally or whether the correlation breaks down near term.


Saturday, June 26, 2010

Potential channel formation


We bounced off 1067.89 which isnt exactly a support level, and although the market internals show a potential reversal I'd be cautious and looking for further confirmation of the bounce. Made a chart update, the yellow lines are parallel and a potential channel forming if the bounce continues.


And the daily chart, a lot of resistance up ahead as the potential of a death cross looms.

Wednesday, June 23, 2010

Yesterday, we smashed through my support lines, the SMA(50) and the SMA(200) on the hourly. This might spell a change in direction with the peak open on Monday down to 1086 (50% fib retrace level) or more. The break below 1100 support is significant.

Monday, June 21, 2010

Yuan peg - Chinese checkers

Back after a week.

SPX broke through the 1100 resistance over the last week. Over the weekend the Chinese announced their inclination to allow the Yuan to appreciate. Markets propped up +120pts at the open only to lose steam at the end. Some reports suggest that initial enthusiasm waned at the realization that the appreciation would be over a long term not quick (Economists have claimed that the Yuan should be 25 - 30% stronger vs USD)

Technically speaking it was interesting, as the market opened up above the 50% retracement line which was a good sign that it would carry the rally higher towards the 61.8% level (which is much higher at 1225) or atleast to the Jan peak in the near term. The view is supported by the golden cross on the hourly view, as the SMA(50) crosses the SMA(200) from below at about 1100. Also the SPX closed at the support line which might provide some support for an upward move tomorrow. On the daily the current level is below the SMA(50) so there is some room for moving higher. What happens we shall find out.

While my view is that the rally shall continue some more, a reversal from the 50% retracement (or close) as we see today might spell the end of the current rally, if the bears take us lower it shall be in size as I've commented earlier.


Thursday, June 10, 2010

1100 up ahead

Below is the hourly chart of the SPX, the bounce off the Feb 5 low appears to have been reaffirmed and the upward resistance of 1100 looks to be tested yet again (for the 4rth time).

Tuesday, June 8, 2010

SPX bounce off Feb 5 lows


Bit of a break there. The markets plunged -450pts on DJI between friday and monday to recover some ground +123.49 today. Bearish outlook is reinforced at the moment with major indices below their 200 SMA

Levels vs SMA(200)
DJI 9939.98 vs 10304.65
SPX 1062.00 vs 1107.16
NASD 2170.57 vs 2236.09
RUT 617 vs 632.76

The Russell 2000 small cap index is the latest to turn bearish (below the 200SMA on the daily close). This is indicative of the broader trend.

Looking at the charts, we have to look at an important support level of the Feb 5, 2010 low.

Levels Feb 5 vs Current
DJI 9835.09 + (but has moved lower on last two days)
SPX 1044.50 + (1042.17 today's low)
NASD 2100.17 + (not breached)
RUT 580.49 + (not breached)

While DJI (clearly) and SPX (in a minor way) have breached the support and RUT turning south we need to be very cautious about this down leg continuing below the Feb 5 support.

Below is a quick chart of the SPX showing some levels and the recent EWT structure.


Friday, June 4, 2010

DJI down 323pts


DJI: -323.31 (-3.15%)
SPX: -37.95 (-3.44%)
IWM: -3.36 (-5.02%)
EUR/USD: 1.2155 (-1.46%)
CL: 71.09 (-4.72%)
GLD: +
1.23 (+1.04%)

Thursday, June 3, 2010

Testing resistance again


DJI: +5.74 (+0.06%)
SPX: +4.45 (+0.41%)
EUR/USD: 1.2239
CL: 74.58 (+2.67%)
GLD: -1.82 (-1.52%)

Mixed economic data today, big numbers expected tomorrow. As much as I can say the Census hiring has created many temp jobs, and the expected non-farm payroll numbers can be anything the govt wants it to be. What does it say about the recovery, not much really. Anyways, talking technical SPX is back at the important level of 1100. Today we tested the level three times. Its an important indication of the upward retracement as investors are beginning to look away from the Eurozone. The level also coincides with the 200 dMA so if we break through we might be in for a short term bull market.


Wednesday, June 2, 2010

Looking at employment data


DJI: +225.52 (+2.25%)
SPX: +27.67 (+2.58%)
GLD: -0.13 (0.11%)


Large rally today probably in anticipation of employment and ISM data tomorrow morning. The SPX has traded below the SMA(200) and 1100 level for the past week, attempting to break back above on May 27 and is positioned to try again tomorrow (close level today 1098.38). This is a key level to watch out for. Oil futures have traded higher currently hovering around $74/barrel and the selloff in the EUR has stalled a bit.

On the macro side, jobs data tomorrow would be a key indicator of whether the US economy is on the path of recovery. We will know tomorrow am

Monday, May 24, 2010

Media hawking for selloff

Thu May 24, 2010 (3.15pm):

DJI: -131.73(-1.29%)
SPX: -15.49 (-0.69%)

I was away from the markets today. Pre-open futures were low and popular news services were hawking "major selloff" earlier on in the day. Market traded sideways most of the day, lacking direction. Hit the low and bounced off it. Still keeping above the support level of 1066 on the SPX, IWM makes for a clear bounce of its low of 62.89 (its 200 SMA). In the short term I'm leaning towards a upward move in the broader market although there is no saying which corner spews some bad news, the market is not very confident.
Once again we had a large sell off in the last 10 mins, something to watch out for.

Friday, May 21, 2010

That was close

Thu May 21, 2010 (10.15pm):

Sold off early on in the morning as I had expected and bounced off a low (lower low than the flash sell off, but only marginally). Last 10 mins saw a +100pt rally which doesn't exactly spell confidence but a rally it was. So via manipulation or otherwise we have bounced off the low. Next week we'll try and see if we can hold on to it.

Thursday, May 20, 2010

Broke SMA(50) support of 1100

Thu May 20, 2010 (11.50pm):

DJI: -376.36 (-3.6%)
SPX: -43 (-3.9%)
CL: -0.73 (+1.03%)
GLD: -0.79 (-0.68%)

Major break below the SPX SMA(200) the 1100 support level was broken vehemently. Next level to watch was the low from the Feb 6 flash sell off of 1065.79. ES futures after hours touched the level so tomorrow open looks likely to to retest although the market appears a bit oversold so a bounce off it might be likely.

Media is reporting the major correction to be in place and talk of an extended bear market (now that SPX is below the SMA(200). Bank regulation bill passed senate and is up for reconciliation, not sure how the market shall perceive it, negatively isn't such a bad guess.

Wednesday, May 19, 2010

SPX bounce off 1100 support

Wed May 19, 2010 (3.30pm) at close:
DJI: -66.58 (-0.63%)
SPX: -5.75 (-0.51%)
EUR/USD: +0.01785 (+1.46%)
CL: +1.85 (+2.67%)
GLD: -2.85 (-2.39%)

The market bounced off the important 1100 support level for the SPX, oil saw a rally ending its three week decline (futures at 71.21). Gold and silver sold off as well.

Eurozone overhang is been causing recent market turbulence with Germany imposing short selling restriction (yesterday) in order to prevent speculation on the bank stocks that own Greek debt. EUR sold off to new lows after the news.

The bounce off the SPX support and the comeback in crude, eur and gold may be read as some restoration of faith in the markets, we may want to see evidence of that in the next few days. Failure to hold this level would portend poorly for the bulls.