After a posting break of sorts.
The market staring down the cliff edge once again. After the sharp selloff between 11th and 25th, we almost fell over into calamity territory. Once again the SPX 1040 level was supported, miraculously I'd say, retested and then supported again. Four times in all since we started down the bearish path in April. Once again we are poised to retest, and this time we might fall over. Tomorrow comes home price data, consumer confidence and to top it all FOMC minutes. Doesn't look rosy at all.
I would think the retest is imminent, thanks to how close it is. I do get the sense that the market is still unsure about breaching 1040 or going down to 1010. Although the media noise is definitely touting increased concerns about the economy. We'll see the price action tomorrow to find out how the month of Sept (traditionally a bear month) fares.
Some respite sure, but what to expect going forward. Below is the hourly graph of SPX going back to June. Comparing the June 26 with our current dip there are definite parallels and the market view appears to be of a selloff to touch our green line support. We'll find out.
What is different, first we seem to have some support at SPX 1010, which is the higher low from the bottom 2009. We've stayed above the trendline for over a month and are a bit away from it at the moment (would require another big selloff to change that). Next I think the moving averages SMA 50 and 200 are way different this time around. So what I'd careful of is a bounce higher as the markets participants look for a dip. Something like the July 19 bounce. In case of a dip I'd watch for the trendline support for a reversal. 
Not posting much today just a plot of SPX. We may get some respite from the bear action.. but touching lower green support seems likely nearterm

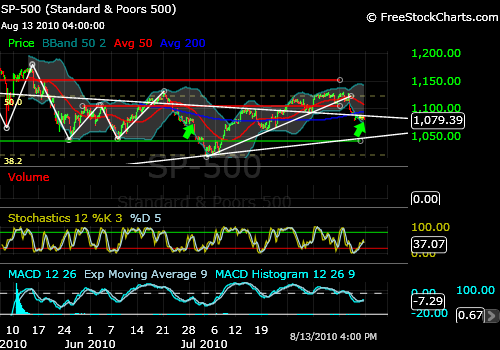
The markets been trading a bit higher lately since almost Aug 1,2010. Was seeing some weakness as short interest increased as we touched the 50% retracement. The thousand or four :) are marked on the chart below. Look at the weakness last week, the support line has held things together so far and we have crossed the 50% line convincingly this time. How much higher, we've talked about it earlier, 1140 remains the high target. As of the moment I'd be looking to short there abouts.

I was looking at my chart (SPX daily) that I've posted many times, and noticed how we've been dissing the bears somewhat and not really rallying. Then I noticed my two lines, the red - resistance and the green - support. I looked at it through 2009 and seems that we could say we've traded in this range since we entered it Sep 2009! That's about 10 months ago!. Anyway so I guess its important and would be interesting to keep an eye on. Breaking above the red then might seem a bit implausible no? Although we've got to go over the 50% line first.
 The stochastics were similar right before the flash crash
Sharp rally today continuing the bounce up, SPX closed up at 1125.86. Markets been overlooking a descent amount of negative news later ref, BP, GDP, initial claims, Beige book etc. It could just be a setup before we take a sharp turn down, but the number of barriers that have been broken so far is definite signal of a sharp local trend upwards. Few resistances nearby, most important is the the 61.8% retracement May high to July low at 1140. Watch it as a short opportunity. If this gets taken out then we have good room for moving higher
Some important Fib levels are in order
1) 1,576 high in October 2007 to the 666 low in March 2009
23.6%: 881
38.2%: 1,014
50.0%: 1,121
61.8%: 1,228
2) 666 low in March 2009 to the 1,219 high in April 2010
23.6%: 1,089
38.2%: 1,008
50.0%: 943
61.8%: 878
3) 1,219 high in April 2010 to the 1,010 low in July 2010. This is the near term Fib we are in right now, near term high is 1140
23.6%: 1,060
38.2%: 1,090
50.0%: 1,115
61.8%: 1,140